Introduction
Agent observability is useful precisely when something goes wrong.
The problem is that observability can become part of the thing you are trying to observe. If every trace is written synchronously, every database operation happens on the request path, or every event has to leave the machine before the run can continue, debugging starts carrying a latency and infrastructure tax.
I wanted a different default for my agent framework:
Recording a trace should never make the agent wait.
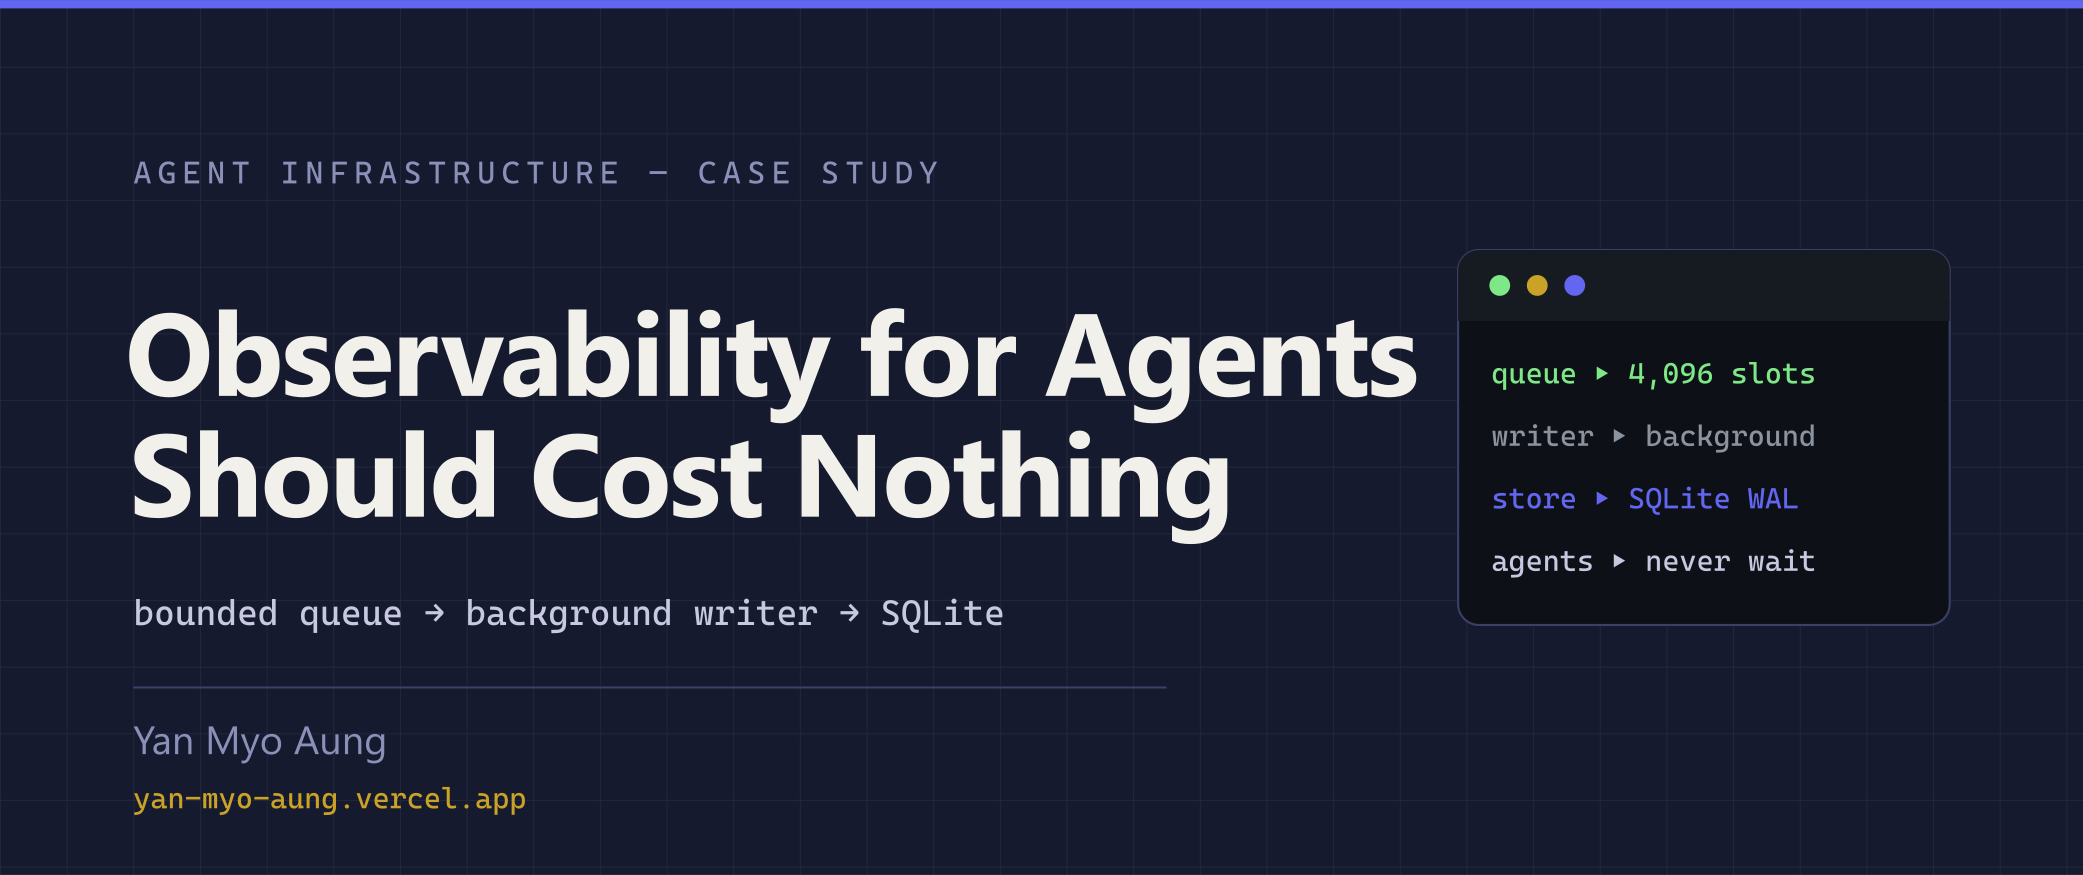
That led to a deliberately boring design: a bounded in-memory queue, one background writer thread, batched SQLite writes, and a local dashboard.
No SaaS account. No collector. No message broker.
The goal isn't literally zero CPU, memory, or disk usage. The goal is to make observability effectively free on the agent's critical path and cheap enough operationally that there is no good reason to turn it off.
The tax nobody notices
Tracing sounds like pure upside until you put it on the critical path.
A typical instrumentation path looks roughly like this:
The agent now depends on the tracing system.
If the tracing system is slow, the agent is slow.
If the tracing system fails, you have another failure mode.
If the tracing system is external, prompts, tool arguments, metadata, and other execution details may also leave the machine.
So teams often make observability conditional:
"We'll turn it on when we need it."
That is backwards.
The incident is exactly when you need the data that you decided not to collect.
I wanted tracing to be the default, not because tracing is free, but because its cost should be small enough that disabling it is harder to justify than leaving it enabled.
One rule: never make the run wait
The architecture is built around one invariant:
Tracing is allowed to lose telemetry. It is not allowed to slow down the agent.
When something worth tracing happens, the agent creates a small event and puts it into an in-memory bounded queue.
It does not wait for SQLite.
It does not wait for a network request.
It does not wait for a database-generated ID.
It moves on.
A background writer drains the queue in batches and commits those events to SQLite.
The important architectural boundary is simple:
The database can be slow without making the agent slow.
That is the whole idea.
The shape of the code
The implementation is intentionally small:
from queue import Full, Queue

queue = Queue(maxsize=4096)

def record(event):
    try:
        queue.put_nowait(event)
    except Full:
        dropped.inc()


def writer():
    while True:
        batch = drain_up_to(queue, 256)
        db.executemany(
            "INSERT INTO spans ...",
            batch,
        )
There are three important decisions here.
1. put_nowait, not put
A normal blocking queue would make queue pressure part of the agent's latency.
I don't want that.
If the queue is full, the event is dropped and a counter is incremented.
The agent continues.
The failure direction matters.
The system degrades from:
complete telemetry
to:
incomplete telemetry
rather than from:
normal agent execution
to:
slow or failed agent execution.
2. IDs are generated before persistence
The trace does not need to wait for SQLite to tell it what its ID is.
IDs are generated by the caller.
That means the agent can create a trace identifier, attach it to logs and events, enqueue the event, and continue without waiting for the database.
The database becomes a persistence layer, not part of the execution protocol.
3. Writes happen in batches
Writing every event independently creates unnecessary transaction overhead.
The writer drains multiple events and persists them together.
Batching amortizes transaction overhead by writing multiple events in a single transaction.
SQLite is particularly useful here because the workload fits its strengths: local writes, structured queries, and relatively infrequent writes compared with reads.
WAL mode also allows the dashboard to read while the writer is committing new data.
Why these three boring tools?
There is a fashionable alternative for almost every component.
I deliberately didn't use them.
Queue instead of a message broker
The events do not need to leave the process.
Adding Kafka, Redis, RabbitMQ, or another broker would introduce infrastructure for a problem that currently exists entirely inside one process.
A bounded in-process queue is enough.
One writer instead of a writer pool
There is no need to turn SQLite into a concurrency puzzle.
One writer gives me a simple ownership model:
The agent workers don't fight over database writes.
SQLite instead of a service
The traces already belong to the machine running the agent.
A database service would introduce:
- credentials
- network configuration
- deployment
- upgrades
- service availability
- another operational dependency
SQLite introduces a file.
That's a very different failure surface.
Boring infrastructure is a feature
The deeper reason for these choices is not that queues, threads, and SQLite are particularly exciting.
They aren't.
That's the point.
Every additional dependency creates another reason for someone to say:
"We don't need observability yet."
A broker needs operating.
A collector needs configuring.
A SaaS platform needs an account and a network path.
A local queue, a background thread, and a database file need almost nothing.
When the cost of enabling tracing becomes approximately:
the question changes from:
"Should we enable tracing?"
to:
"Why would we disable it?"
What the benchmark says
The repository includes a benchmark comparing the recorder's hot path with tracing disabled and enabled.
The current result is:
| Setup | Time per run |
|---|---|
| No tracing | 0.067 ms |
| With recorder | 0.113 ms |
| Overhead | +0.047 ms |
The important number is the absolute overhead:
0.047 ms
There is an important caveat.
The benchmark uses a fake model backend, so the measured agent execution time is extremely small. That makes percentage-based comparisons misleading.
A real model invocation typically dominates the execution time by orders of magnitude.
For that reason, the benchmark gate focuses on absolute recorder overhead, rather than claiming that the percentage overhead represents a real production model workload.
The build is configured to fail if the measured overhead crosses 1 ms.
That gives the tracing layer a concrete performance budget.
The benchmark is not proof that every possible workload will have 0.047 ms of overhead.
It is a regression guard for the recorder's critical path.
Failure should move in one direction
This is the most important failure policy in the design.
If the queue fills:
If the writer encounters an error:
The agent should not fail because its debugging system had a problem.
That sounds obvious, but it is easy to accidentally violate.
For example:
trace_id = db.insert(event)
looks harmless until the database becomes slow.
Now the database is part of your agent's critical path.
The design here deliberately avoids that dependency.
Shutdown is part of observability
There is another easy-to-miss problem with asynchronous tracing.
If the process exits immediately, events sitting in the queue disappear.
That means graceful shutdown matters.
The writer drains pending events before the process finishes so the tail of the execution is not unnecessarily lost.
Asynchronous does not mean:
"Write whenever you feel like it."
It means:
"Write independently from the agent's execution, but still manage the lifecycle correctly."
Context propagation across workers
Agent systems are rarely single-threaded.
Tool calls, background workers, and parallel tasks make trace context propagation another problem.
A worker should know which run it belongs to.
But thread-local context does not automatically follow every thread boundary.
The framework therefore captures the relevant context when a worker is created, restores it inside the worker, and cleans it up afterward.
Without this, the dashboard becomes a collection of disconnected events rather than a trace of one execution.
A database, not a service
The storage layer uses SQLite and JSON.
The current schema covers the main things I want to inspect when debugging an agent:
- runs
- spans
- tool calls
- token usage
- evaluation results
Trace IDs also appear in logs, giving me a common identifier across the execution and its persisted telemetry.
The dashboard reads the same database locally and binds to loopback by default.
That matters because traces can contain sensitive information:
- prompts
- tool arguments
- model outputs
- internal metadata
If the dashboard is exposed beyond the local machine, authentication is required.
Exporting to larger observability platforms is possible, but it is deliberately opt-in.
The default system does not require an external collector.
Traces and evaluations belong together
Once traces already exist locally, another opportunity appears.
Agent evaluations can use the same store.
The evaluation runner takes an agent and a set of examples, then evaluates the outputs using deterministic checks such as:
- exact match
- substring checks
- pattern matching
- schema validation
- latency limits
An optional reviewer model can handle cases where deterministic checks are insufficient.
Reviewer inputs are explicitly treated as data rather than instructions, and reviewer output is parsed as structured JSON rather than executed.
The important part is not the evaluator itself.
It is the relationship between evaluations and traces.
Now a release can answer two different questions from the same store:
Did the behavior regress?
and:
What actually happened during the execution?
The evaluation tells me that something changed.
The trace helps explain why.
Regression data becomes more useful with traces
Each evaluation report compares against a baseline.
An example can be classified as:
- regressed
- fixed
- new
- unchanged
That means every release can carry its evaluation delta forward.
Because the evaluation data lives alongside the traces, the system can eventually connect a release, its regression, the affected run, and the underlying tool or model interaction.
That is considerably more useful than a single score saying:
"The agent got worse."
The honest limit
The design has a real weakness.
Under burst load, the bounded queue can fill.
When it does, spans are dropped.
There is currently no persisted record describing exactly which events were dropped, and there is no backpressure mode for workloads where losing telemetry is unacceptable.
That means the exact events you might want during an extreme incident can be the ones that disappear.
That's a real trade-off.
The current system chooses:
never slow the agent
over:
never lose telemetry
For this framework, that is the current invariant.
But it is still an invariant with a cost.
A future version could provide an explicit reliability mode where users choose between two behaviors:
I would rather expose that trade-off than pretend it doesn't exist.
The actual goal
The goal was never to make observability literally free.
CPU isn't free.
Memory isn't free.
Disk isn't free.
The goal was to make the cost of not having observability higher than the cost of keeping it enabled.
That requires one architectural rule:
Non-essential work must stay off the critical path.
For this agent framework, a bounded queue, one background writer, and SQLite are enough to make that practical.
No collector is required.
No external service is required.
No network dependency is required.
And most importantly, the agent does not have to wait for its own telemetry.
That's the kind of infrastructure I want around agents: boring, local, measurable, and difficult to accidentally turn off.